When hunting, there are times that rather than searching by data type, it’s more efficient and effective to search for a specific indicator. That “indicator” can take many forms, but a few that come immediately to mind are assets, accounts and file names. Assets of interest could be internal or external. It could be an IP address, but it could also be a MAC orhostname. On the other hand, your hunt may be focused on user accounts and the identity associated with those accounts. Finally, we might want to hunt for the presence of a specific file or process within our environment. These artifacts can all be hunted with SA-Investigator for Enterprise Security.
For those not familiar with Splunk Enterprise Security (ES), it provides a set of robust frameworks for threat, risk, asset & identity, incident management and adaptive response. With Splunk ES, we can search for events involving all sorts of event data—from Network Traffic, to Malware, to DNS and much more as well as build correlation searches around these data sets that will alert and can even take predefined actions on your behalf.
SA-Investigator is designed as an add-on to Enterprise Security to take advantage of pivoting from the Incident Management framework, as well as integrating with the Asset and Identity framework. Analysts use Workflow Action to pivot from a notable event into an asset or identity hunting view. Hunters can also search for a specific asset or identity to learn more about what it’s doing. But enough talking, let’s dive into our scenario.
The Good Stuff
Let’s say we’re focusing our hunt on an internal IP address that has had some suspicious activity. To build our hypothesis, we need to learn more about this system, so we enter the value of the asset—10.0.2.107
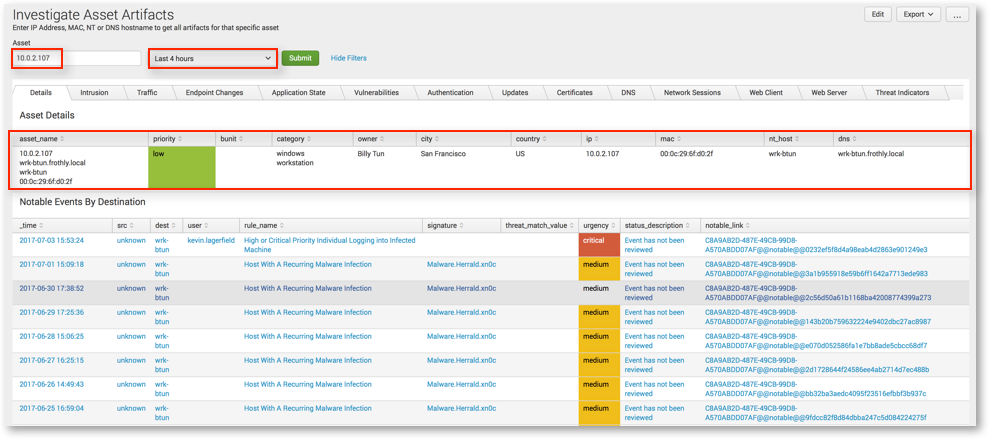
You’ll immediately notice the context of the asset and the notable events associated with it. But wait, what happens if we don’t have assets in our system? No problem—we can still search for these artifacts, we just won’t have the additional context available to us.
(As a side note: we’ve populated the asset table in Splunk ES which provides this context. As such, we can see multiple ways the same asset is characterized; IP, hostname, MAC, NT hostname. If we associate the asset with more than one of these values, by entering just one of the asset values, it will search across the rest! We can also set a time range for our hunt.)
We can begin hunting across different types of data. From alerts generated by Intrusion Detection Systems and anti-virus to network traffic, authentication events, audit logs and other events associated with the system, the choice is yours!
For example, if you wanted to determine what Endpoint Changes happened on this system, you could pivot in Splunk to see any changes that happened at a specific time of day. This would allow you to review any associated Window Event logs for that system as well as changes being made by particular users. The box in red shows us that a user appears to be creating and modifying a new account on the system.

Pivoting to view authentication data, we can see that authentications occurred to various systems on the network from our asset in question using several different credentials, including a service account. We might want to understand more about where that service account is being used and potentially abused, so let’s pivot from an asset view to an identity view.

Much like assets, if multiple accounts are associated with an identity, searching one account will return all associated accounts! Hunting for the “service3” account, we see within the Application State data that a series of processes are kicking off under this account on both our original system of interest as well as others. Interestingly, the processes executing are triggering in the same order on each system as well; this is definitely of interest!

Since we started with a system of interest and then pivoted to a potentially suspicious account, we may want to continue our hunt to see what any associated processes are doing.

As an incident responder, your eyes are probably drawn to the after-hours FTP activity by user billy.tun directly after the original cluster of events. Notice that we also see ftp events from two other distinct workstations under the same user account. Using Splunk visualizations, we can expand the processes over time and drill in on that user.
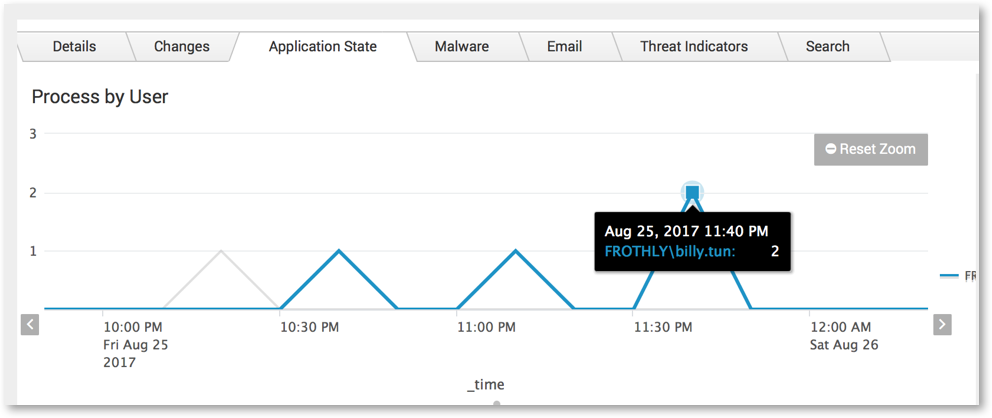
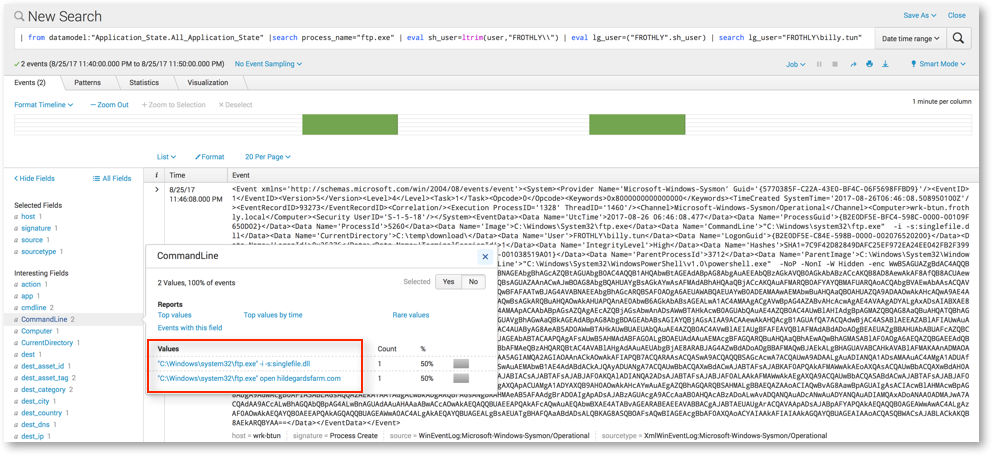
Since we are brilliant and use Microsoft Sysmon, when we click on the timechart, we trigger Splunk to drill down into the raw data. In this case, we can see all the events where ftp.exe was seen as the process during our selected time frame by the user Billy Tun.
Splunk returns two events that match this criteria and we are able to review the encrypted PowerShellcommands being executed, along with their parent processes that may be useful for this hunt or a future hunt.
You would then take these indicators and feed them back into Splunk Enterprise Security to alert on similar indicators in the future.
Conclusion
This very brief example of SA-Investigator for Enterprise Security highlights the three views included with the app. We recently released version 1.1 which adds the ability to search for multiple assets concurrently and the ability to exclude domains, file names, Windows Event codes, processes and services that might create noise for the analyst.
Our goal is to provide the hunter a tool to quickly and easily look across their data and identify information that is useful to them. This allows hunters to use Splunk Enterprise Security to add indicators to the threat intelligence framework, create notable events, and build investigations and track them to closure. We hope you check it out SA-Investigator app for free on Splunkbase.
Happy Hunting! 🙂
Recent Comments