The Splunk presence at HIMSS has grown significantly since our first appearance in 2015, where we had a small booth but a heart of gold. I remember the puzzled looks on most attendees’ faces as they passed by, probably wondering why a big data software company was there, sandwiched between medical devices and claims software. But that didn’t stop them from loving and laughing at the Splunk t-shirts. Fast forward three years later to HIMSS18, where we showed up with our much-coveted t-shirts and our shiny, new Splunk booth, turning heads and even causing a few to stop in their tracks to snap photos.
While it’s true that our famous t-shirts can always draw a crowd, HIMSS 2018 felt different. The puzzled looks from three years prior had now turned into wanting to know more about Splunk solutions for healthcare. In fact, the question we got asked the most during our discussions with attendees was, “But why Splunk for healthcare?” Our answer: “Well, why not?”
Get Better Insight Into Your Machine Data
We’ve seen this across different industries over the years; conference topics are trending to help people understand how they can better use data to add business value and help customers. And as our lives become more digital and connected, the amount of data being generated isn’t stopping anytime soon, so it’s no surprise that healthcare organizations can also benefit from understanding their data.
Healthcare organizations generate tons of machine data, making it perfect for Splunk. Data from their infrastructure, applications, electronic health records (EHRs), and IoT medical devices—all of these data sources offer valuable insights for healthcare organizations. But they need a way to aggregate, correlate and analyze these different data points.
Many attendees were looking to see how to solve daily data challenges—from better managing healthcare centres to getting value out of their medical device data; from maintaining HIPAA compliance to security monitoring and fraud detection. And if there’s one thing that gets our heart pumping, blood flowing and pulse elevated (all puns intended), it’s explaining how Splunk can help you get the most from your data (and prevent you from flatlining).
Understanding your critical assets and your machine data is more important than ever. Without knowing your data, it’s hard to create a good plan or make informed decisions and quickly remediate when an incident does occur. It would be like if you had a pain in your foot, but instead of going to the doctor you looked at WebMD for a diagnosis and treated the pain yourself.
Don’t take our words for it though, check out how Cerner Corporation—one of the world’s largest healthcare software IT companies—uses Splunk to achieve visibility into more than 180 million transactions annually. Want to do the same? Check out the “cookbook” of examples and use cases that already exist to help you get started.
Combating Against Fraud
With all the new technologies and digitalization of our lives, the healthcare industry is just as susceptible to security and fraudulent threats. The U.S. Department of Justice estimates that healthcare fraud alone costs the country tens of billions of dollars a year. It says some estimates “put the figure closer to $100 billion.” Of course, with those kinds of figures, you can imagine there are many ways the healthcare industry is encountering fraud—from billing errors and Medicare fraud, to medical equipment fraud and pharmaceutical fraud. Check out our recent blog series on healthcare fraud and see how a Splunk expert used the Centers for Medicare and Medicaid (CMS) published datasets and Splunk Enterprise to discover anomalous and potentially fraudulent providers, and predict whether a given provider will be excluded from participation in Medicare.
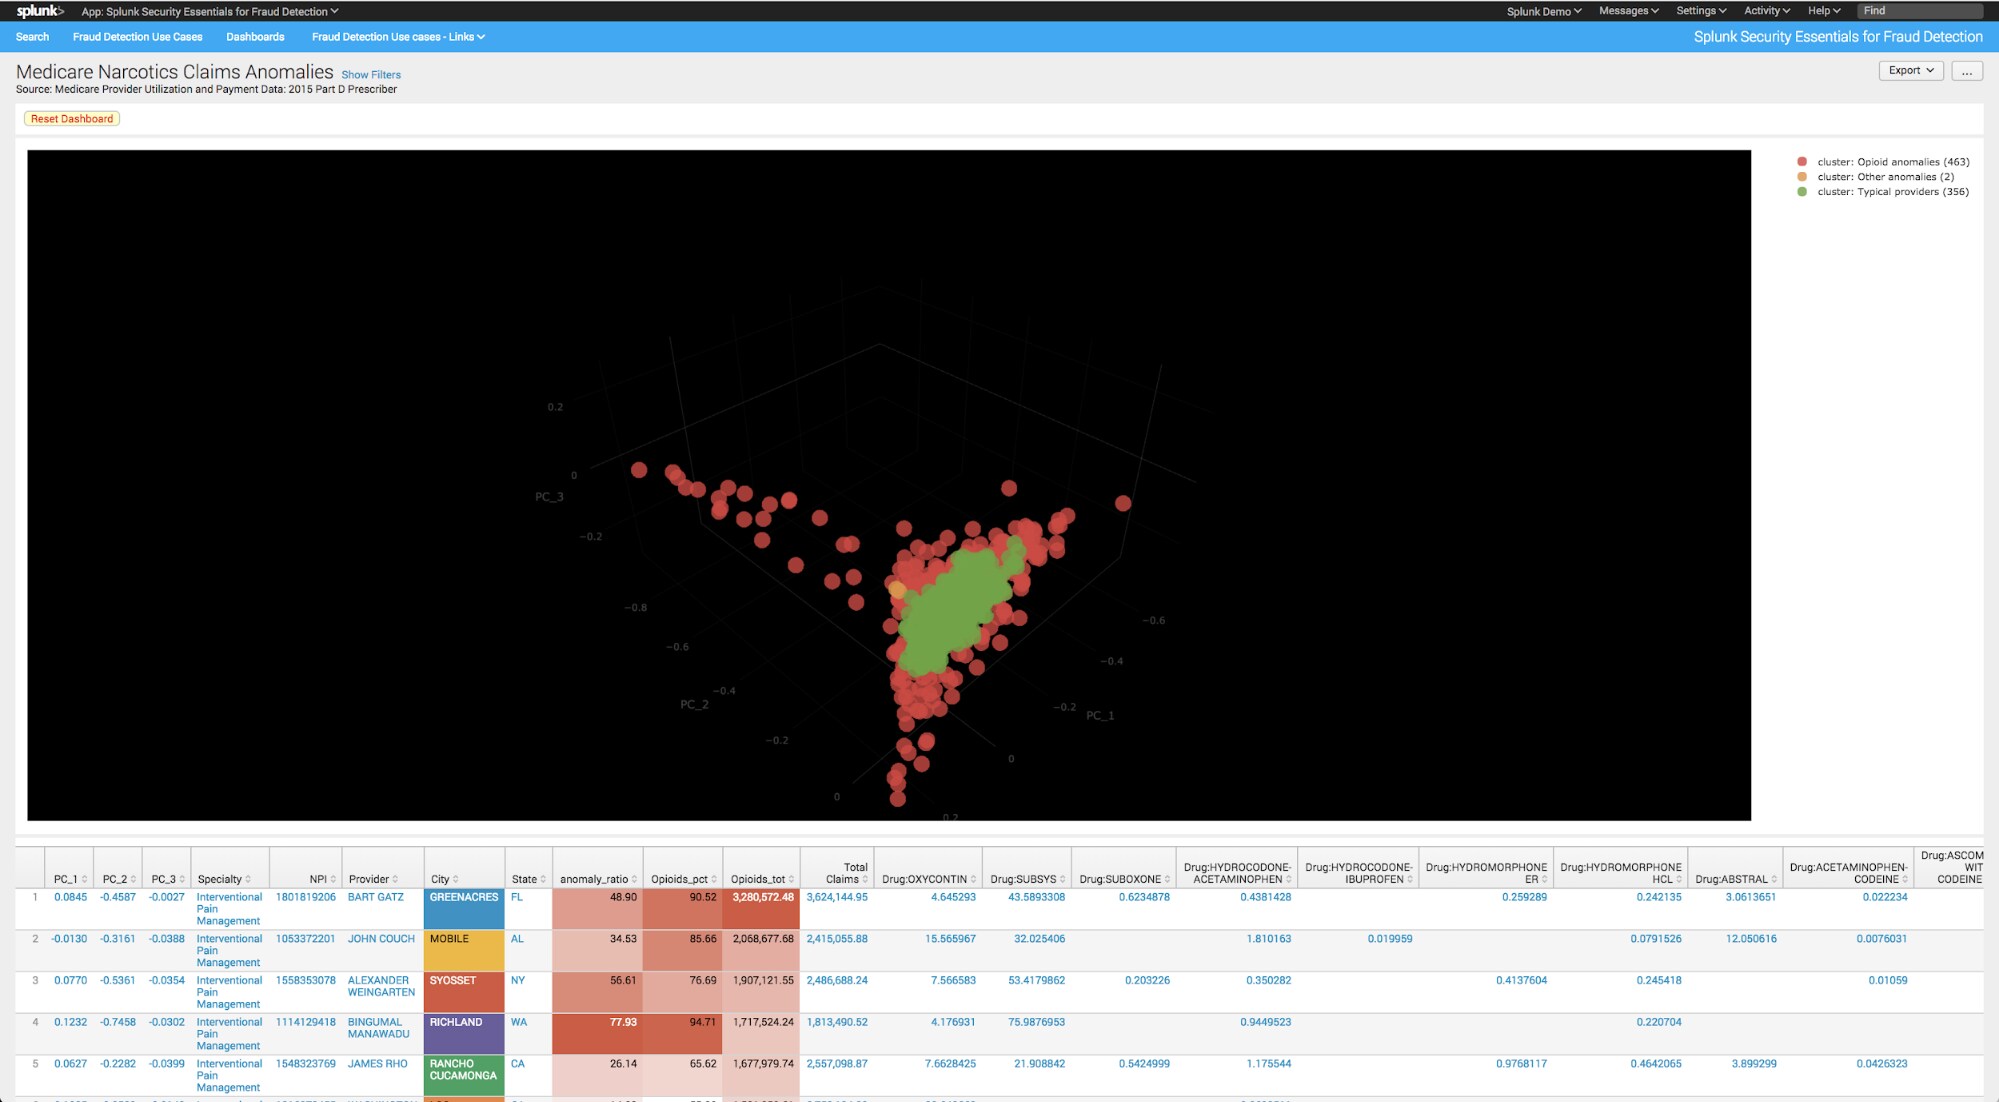
Pharmaceutical fraud is ever present and has been top of mind with recent news coverage of the “opioid crisis.” Machine data can help identify anomalous providers with highly abnormal prescription drug distributions and volumes compared to their peers, as well as get better visibility into each provider and their speciality. You can begin to filter the data down based on geography, speciality, drug type, total claims billed and anomalous drug percentages.
This, of course, is just a teaser for the endless causes of your specific data pain—trust us, we’re data doctors. However, if you’re like us and always want a little more data, some of our fraud experts will be hosting a webinar on all things fraud. Register today for our upcoming webinar, “Find Fraud’s Fingerprints in Machine Data.”
Recent Comments